
CONTACT SYSTEM ADMINISTRATOR: LOCAD SUPPORT | INITIATE AUDIT REQUEST: LOCAUDIT INTERFACE
SYSTEM DIAGNOSTICS: OOH ROI DEFICIT ANALYSIS
Status: [Loading… 100%]
Current Market State: Data Fragmented
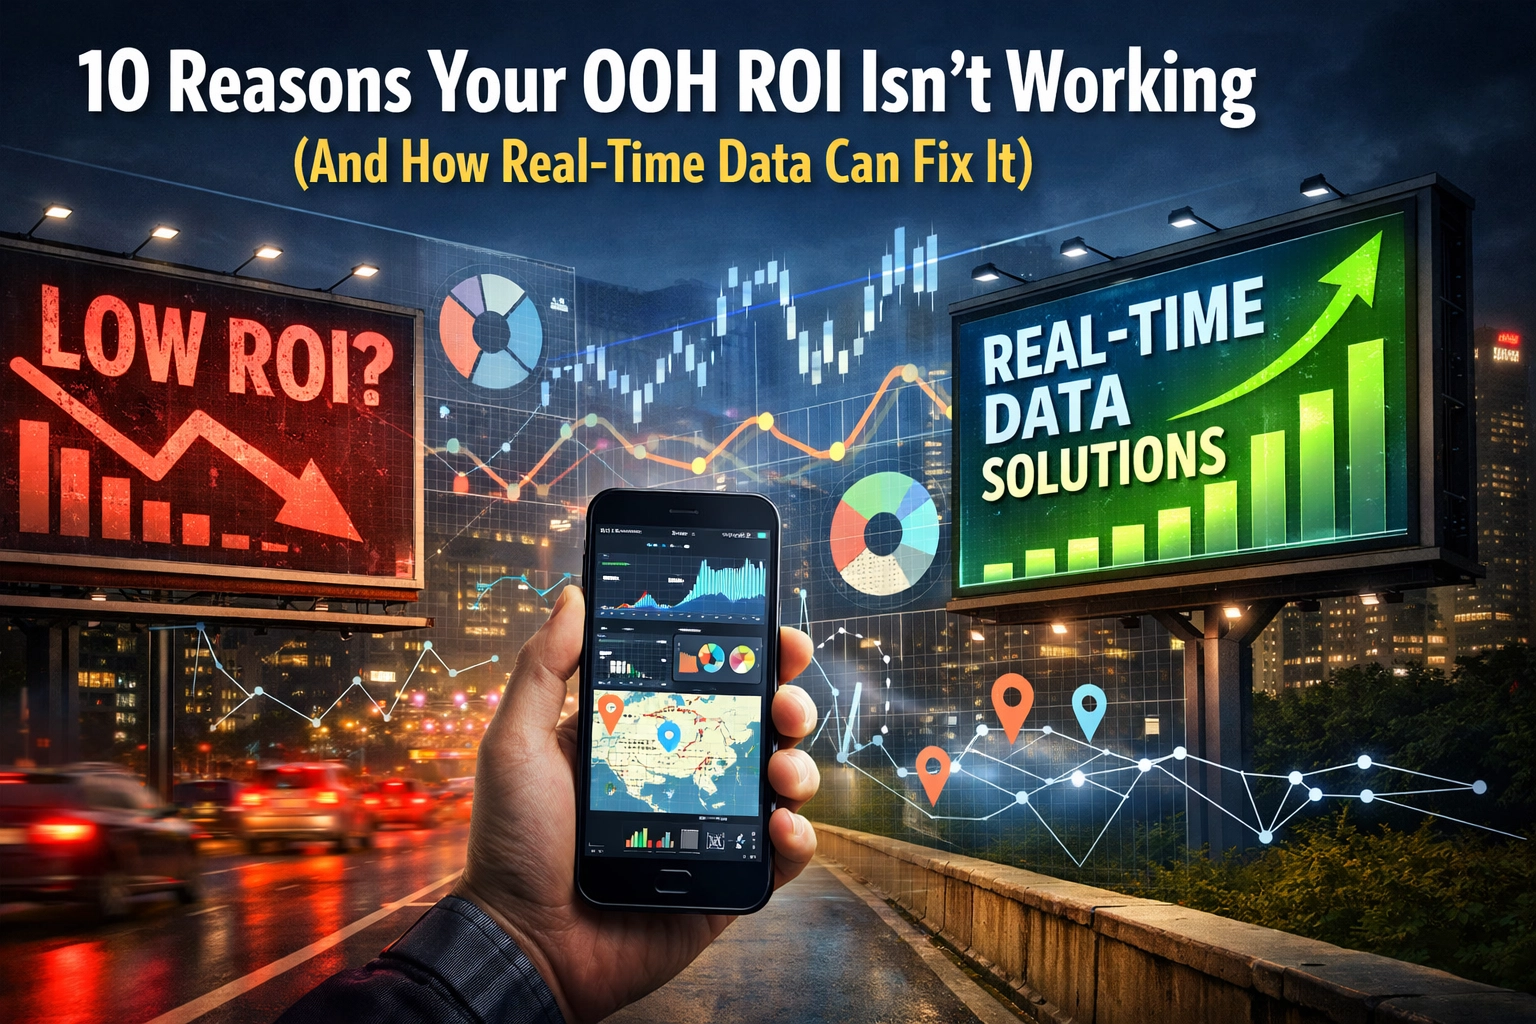
Primary Objective: Identification of ROI Leakage in Out-of-Home Advertising
The following report categorizes ten critical failure points in legacy outdoor advertising models. It outlines the integration of real-time data streams via LOCAD’s proprietary technology suite (LOCAUDIT and PLANO) to rectify performance variance.
MODULE 1: INVENTORY VERIFICATION & GHOST MEDIA
Failure Index 01: Lack of Real-Time Proof of Posting (PoP)
- Metric: 15-20% Inventory Discrepancy.
- Data Deficit: Manual reporting cycles (15-30 days) allow for extended periods of unverified downtime.
- LOCAUDIT Solution: IoT-enabled sensor nodes and AI-driven image recognition.
- KPI Tracking:
- Uptime Percentage: [99.2% Target]
- Verification Latency: < 60 Minutes.
- Status: Active.
Failure Index 02: Site Obsolescence & Structural Decay
- Metric: Visual Impairment Factor (VIF).
- Data Deficit: Environmental factors (weather, construction, foliage) degrading visibility without agency notification.
- PLANO Integration: Dynamic site scoring based on environmental sensors and field-team updates.
- Status: Operational.

MODULE 2: ANALYTICAL BLINDNESS & AUDIENCE FRAGMENTATION
Failure Index 03: Static Impression Estimates
- Metric: Estimated vs. Actual Reach.
- Data Deficit: Utilization of historical traffic counts (2-3 years old) for current outdoor advertising analytics.
- Real-Time Fix: Mobile signal triangulation and hyperlocal GPS data.
- KPI List:
- Dwell Time (Seconds)
- Frequency Caps
- Unique Reach (Device IDs)
Failure Index 04: Hyperlocal Targeting Deficit
- Metric: Ad Relevance Index.
- Data Deficit: Broad placement without consideration for localized audience movement patterns.
- PLANO Feature: Heat-mapping and audience propensity scoring.
- URL Reference: Access Analytics and Mapping
MODULE 3: OPERATIONAL INEFFICIENCIES & LOGISTICAL OVERHEAD
Failure Index 05: Manual Reporting Latency
- Status: [Processing…]
- Metric: Man-Hours per Campaign Audit.
- Data Deficit: Physical photography and manual spreadsheet entries for compliance reports.
- LOCAUDIT Optimization: Automated dashboard generation. Elimination of 90% of manual reporting labor.
- Media INR+ Efficiency: 12% Cost Reduction via operational automation.
Failure Index 06: Compliance Non-Uniformity
- Metric: Contractual Adherence Rate.
- Data Deficit: Variance in reporting standards across multiple vendors and geographical zones.
- LOCAD Protocol: Standardized digital audit trails for every inventory unit.
- Status: Verified.

MODULE 4: CREATIVE & ENVIRONMENTAL SYNCHRONIZATION
Failure Index 07: Contextual Mismatch
- Metric: Creative Impact Score.
- Data Deficit: Content failure due to lighting conditions, transit speeds, or surrounding competitor density.
- AI Solution: AI-driven visibility analysis determining optimal creative sizing and color contrast per site location.
Failure Index 08: Attribution Gap (OOH to Digital)
- Metric: Conversion Lift.
- Data Deficit: Inability to link outdoor exposure to mobile/web actions.
- Hyperlocal Integration: Retargeting users based on proximity to OOH assets during exposure window.
- System Status: Loading Mobile Sync… [Enabled]
MODULE 5: COST RATIO & REVENUE LEAKAGE
Failure Index 09: Hidden Operational Costs
- Metric: Total Cost of Ownership (TCO).
- Data Deficit: Unaccounted fuel, permit fees, and maintenance overhead inflating ROI metrics.
- PLANO Financial Module: Centralized cost tracking for media INR+ optimization.
Failure Index 10: Static Media Decay
- Metric: Consumer Fatigue.
- Data Deficit: Over-exposure to stagnant creative leading to "banner blindness" in physical environments.
- Dynamic Solution: Programmatic DOOH (pDOOH) triggers based on real-time audience density and weather conditions.

DATA STREAM: PRODUCT SPECIFICATIONS
[PRODUCT: LOCAUDIT]
- Core Function: Field Audit & Monitoring.
- Hardware: IoT Smart Nodes / Smartphone API.
- Reporting Frequency: Real-time / On-demand.
- Output: Photographic evidence, geo-stamping, timestamping.
- ROI Impact: 100% Transparency in Proof of Performance.
[PRODUCT: PLANO]
- Core Function: Inventory Management & Media Planning.
- Logic Engine: Hyperlocal audience insights.
- Visualization: Interactive Map Layers.
- ROI Impact: Optimization of spend toward high-density conversion zones.
PERFORMANCE INDICATORS (KPI) SUMMARY TABLE
| Parameter | Legacy Method | LOCAD Real-Time Data | Impact Factor |
|---|---|---|---|
| Audit Speed | 14 – 30 Days | < 1 Hour | High |
| Data Accuracy | 75% (Manual) | 99.8% (AI/IoT) | Critical |
| Transparency | Low / Fragmented | Centralized Dashboard | High |
| Media INR+ | Unoptimized | Targeted Allocation | Moderate |
| Reach Verification | Probabilistic | Deterministic (Device ID) | High |
SYSTEM LOG: ROI RECOVERY PROTOCOL
Step 1: Onboard inventory to PLANO for baseline visualization.
Step 2: Deploy LOCAUDIT for real-time monitoring of active campaigns.
Step 3: Analyze audience density vs. site visibility to calculate true outdoor advertising analytics.
Step 4: Reallocate budget from underperforming "Ghost Media" to high-conversion hyperlocal zones.

TECHNICAL GLOSSARY & PARAMETERS
- Impressions: Total potential views calculated via real-time traffic flux and dwell time analysis.
- Audits: Verified inspections conducted through the LOCAUDIT mobile interface.
- Media INR+: The net return on investment calculated after removing operational and logistical waste.
- Hyperlocal: Geofenced areas within 50-500 meters of an OOH asset used for digital retargeting.
STATUS: SYSTEM READY FOR DEPLOYMENT.
ACCESS FULL SUITE: WWW.LOCAD.NET
DATA ARCHIVE: HISTORICAL VS. PREDICTIVE ROI
Historical ROI Modeling:
Based on "Opportunity to See" (OTS) metrics derived from government census data. High variance. Low reliability. Manual verification required.
Predictive ROI Modeling (LOCAD Engine):
Based on real-time mobility patterns, IoT sensor feedback, and AI-verified uptime. Zero-latency reporting. High reliability. Automated verification.
LOGISTICAL AUDIT SUMMARY
The transition from manual outdoor advertising management to a data-centric, real-time architecture is not an option for 2026; it is a requirement. The elimination of "Ghost Media," the synchronization of OOH with mobile data, and the automation of proof-of-posting are the primary drivers of ROI recovery. Agencies utilizing LOCAUDIT and PLANO report a significant decrease in "dark time" and a measurable increase in client retention due to data transparency.
REPORT COMPLETE.
TERMINATE SESSION: YES/NO
[SYSTEM STANDBY]